The cash rate alone tells you very little about Australian property prices.

Key takeaways
- Decision. The RBA hiked the cash rate target by 25 basis points to 4.35%, the third consecutive hike in 2026.
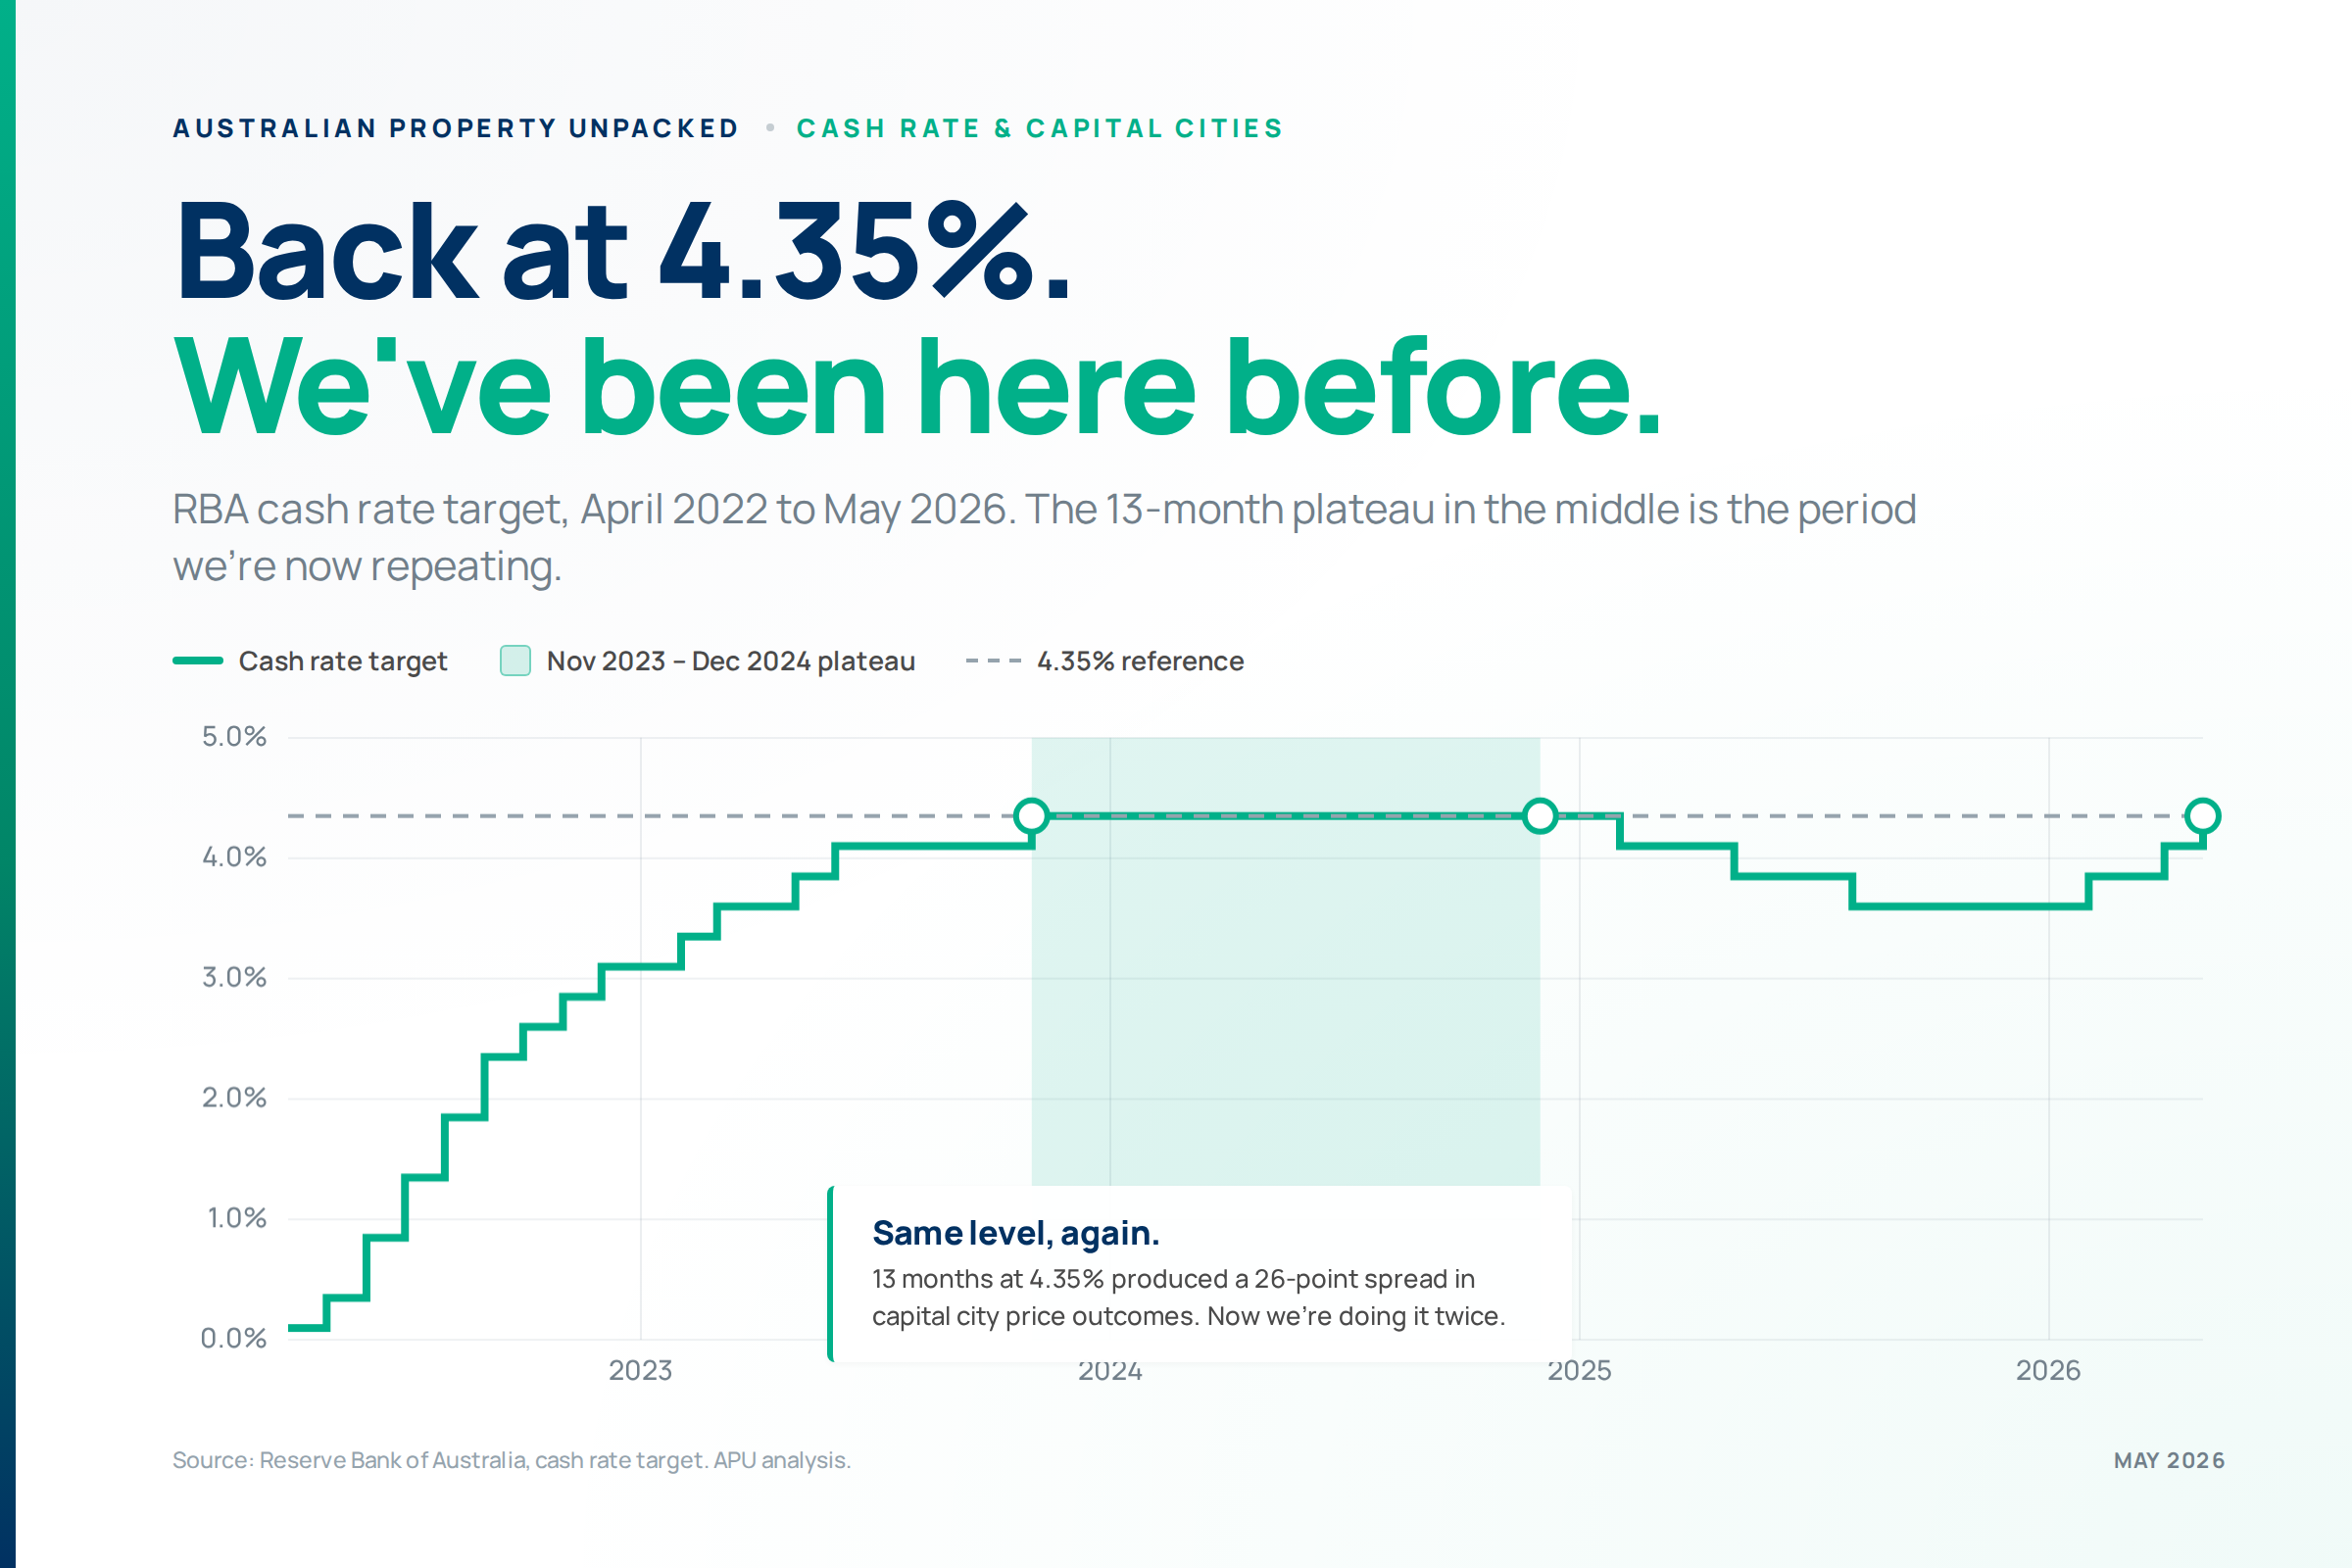
- Cycle. All three rate cuts the RBA delivered through 2025 are now reversed. The cash rate is back at the level it held for 13 months across November 2023 to December 2024.
- Mortgage impact. The May hike adds about $115 a month to repayments on a $700,000 variable-rate home loan, assuming banks lift their mortgage rates by the same amount. The three 2026 hikes together cost about $340 a month.
- Investor signal. Last time the cash rate sat at 4.35% for 13 months, the gap between the strongest and weakest capital was 26 percentage points. The cash rate was identical for all of them. What set them apart was their local supply-demand balance. Two indicators of this balance, months of stock and days on market, moved differently across cities: months of stock tightened everywhere, but days on market shortened in some cities and lengthened in others. That’s what tracked the gap.
The decision
On 5 May, the RBA raised the cash rate target to 4.35%, the third consecutive 25 basis point hike since February. The cash rate is the headline interest rate the RBA sets. It flows through to the rates banks charge on mortgages and pay on savings. The May move fully reverses the three rate cuts the RBA delivered through 2025 and returns the cash rate to the level it sat at for 13 months across late 2023 and 2024. For mortgage holders, the three 2026 hikes together add about $340 a month to repayments on a $700,000 variable-rate home loan, assuming banks lift their mortgage rates by the same amount each time. Repayments are now back where they were at the start of 2025.
The last time the rate sat at 4.35%
We’ve been at 4.35% before. The cash rate held at this level for 13 months between November 2023 and December 2024. The conventional reading is that high rates push prices down. But across those 13 months, national dwelling values rose 8.3%. Higher rates didn’t translate into lower prices nationally.
The national figure also hides a lot. Capital city outcomes were anything but even.

Same cash rate. Eight cities. A 26 percentage point gap between Perth and Hobart over 13 months. The cash rate didn’t drive that, because it was the same in every city.
If rates were the main driver, the cities should have moved together
The conventional reading is that the cash rate is the dominant force on property prices. The cash rate does apply equally to every market, so if that reading were right, the eight capitals should have moved roughly together when the rate held steady. Instead, they moved 26 percentage points apart. Something other than the cash rate was doing most of the work.
Two ways to measure the supply-demand balance
Price comes from the balance between supply and demand. Rates work mainly on the demand side: they raise borrowing costs, which means fewer buyers can afford to borrow as much. The cash rate moves the same way in every city, so the pressure on demand is broadly the same across the country. Supply is local, and it varies a lot from city to city.
To test what was setting the cities apart during that period, we can look at two indicators of the supply-demand balance. We measure the change in each indicator across the period, so we’re comparing how things moved in each city.
Months of stock. How many months it would take to sell every current listing at the recent sales rate. A falling number means listings are shrinking compared to sales, either because fewer homes were listed, or more were sold, or both.
Days on market. How long a typical home spends listed before it sells. A falling number means homes are selling faster, which usually reflects stronger buyer demand. It can also reflect tighter supply or sellers pricing more aggressively.
Cotality calculates both metrics at the capital city level. Looking at the change between November 2023 and December 2024 tells us whether each city’s supply-demand balance tightened or loosened across those 13 months, regardless of where each city started.
What happened across those 13 months
Two things stand out.
Months of stock tightened in every single capital. The range was −12% to −58%, but every city saw listings shrink compared to sales. How much each city tightened doesn’t line up with how prices moved. Darwin tightened the most but went nowhere. Perth tightened the least but boomed. Whatever caused months of stock to tighten, the size of the tightening didn’t predict prices.

Days on market moved in different directions. Three cities saw homes sell noticeably faster (Perth, Brisbane, Adelaide). Three saw homes sell noticeably slower (Sydney, Melbourne, Hobart). Two were roughly flat (Canberra, Darwin). This is where the city-level variation lives. The cities where homes sold faster across those 13 months saw price growth. The cities where homes sat longer saw price falls.

Together, the two indicators tell a coherent story. Listings shrank compared to sales in every capital, but days on market moved in opposite directions. The cities where homes sold faster saw prices grow; the cities where homes sat longer saw prices fall. That’s what tracked the 26 percentage point gap.

The bottom line
Three hikes in three months returns the cash rate to its 2024 peak. The conventional reading is that prices fall when rates rise. The historical record from the last time we sat at 4.35% says it’s not that simple.
Price comes from the balance between supply and demand. Rates pull on demand. During the 2023-24 period at 4.35%, every capital saw listings shrink compared to sales. But days on market moved in opposite directions across cities. Where homes sold faster, prices grew. Where they sat longer, prices fell. Same cash rate, eight different selling speeds, eight different outcomes.
At any given cash rate, what drives a city’s prices is its local supply-demand balance. Two indicators of this balance are months of stock and days on market. Months of stock tells you the balance between listings and sales. Days on market tells you how fast that balance is moving. The cash rate doesn’t directly tell you about either. Watch the indicators, not just the rate.
Cut through the noise on Australian property
Subscribe for free.


