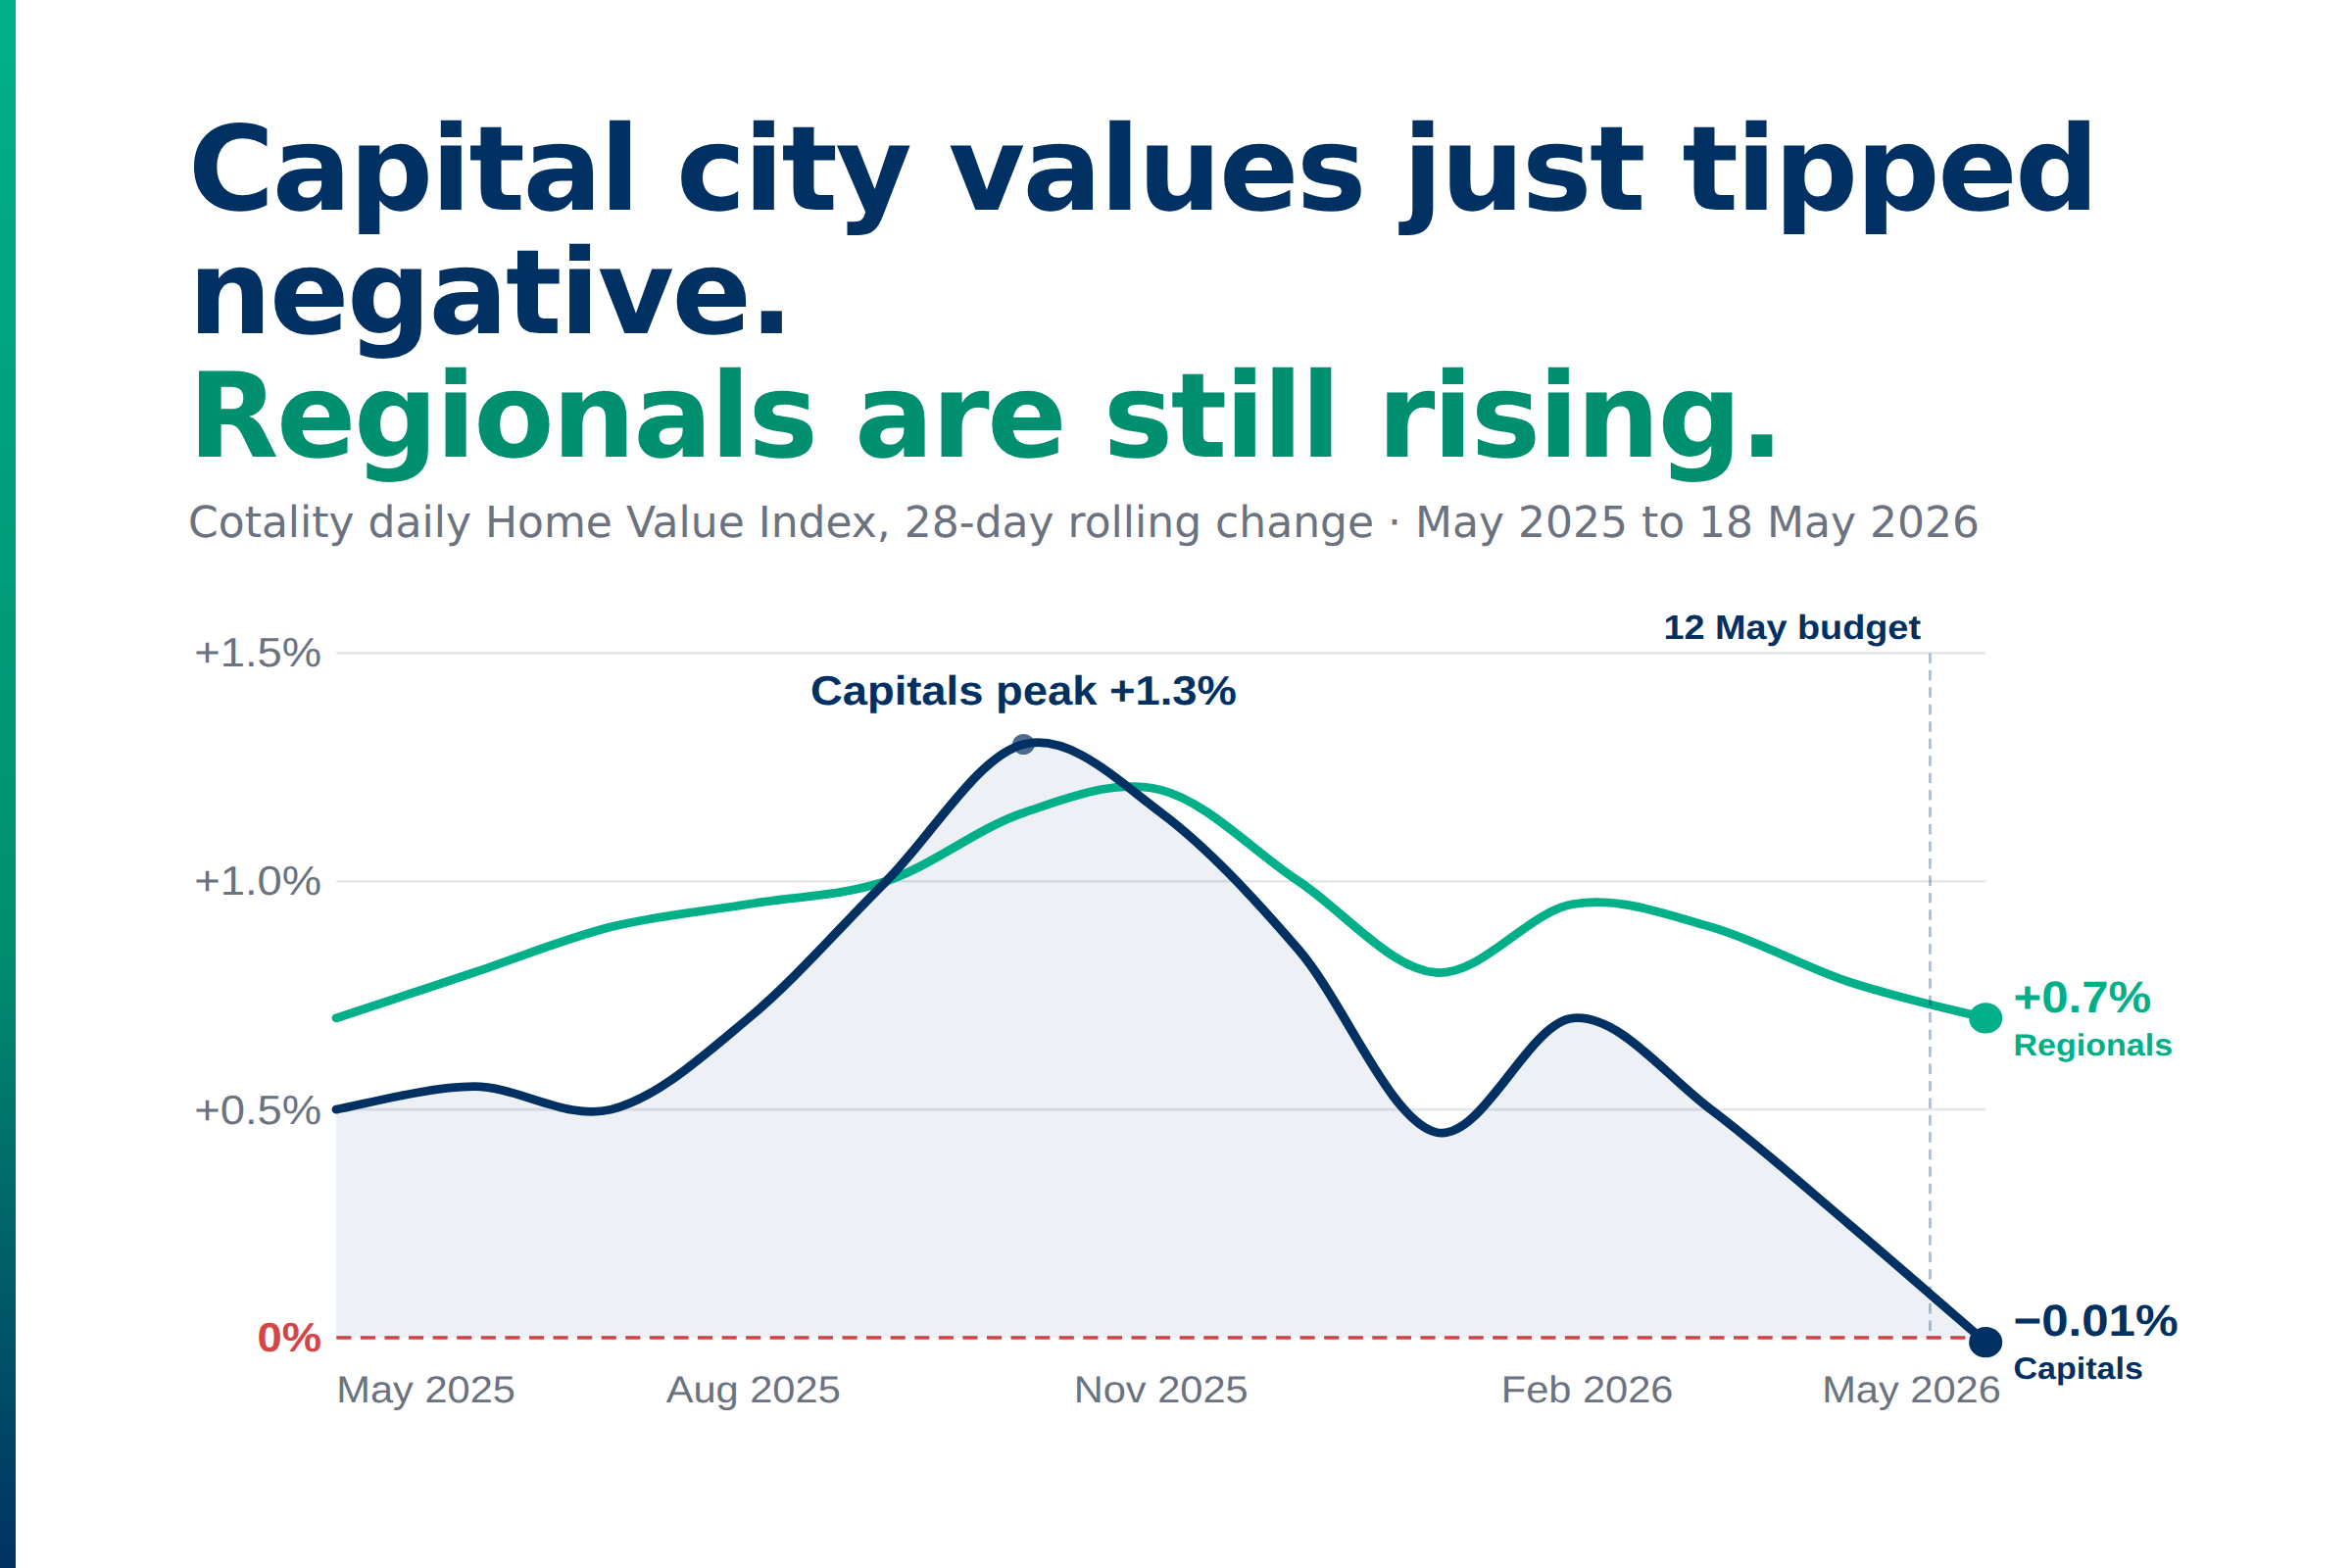
The direction was already turning before 12 May. Capitals fell 0.01% over the past 28 days while regionals are up 0.7%. The split between cities and regions is the bigger story.

Key takeaways
- First post-budget read: the 2026-27 federal budget landed on 12 May. Cotality’s daily index is the only fresh read on what the market has done in the six days since.
- The flip is real, but it’s continuation, not reaction: capital city values fell 0.01% over the 28 days to 18 May, the first time Cotality’s daily reading has gone negative for the combined capitals. Sydney and Melbourne have been softening since November 2025, well before the budget.
- Two-speed cities: Sydney and Melbourne are both down 0.7% over the past 28 days. Perth (+1.7%), Brisbane (+1.0%) and Adelaide (+0.8%) are still rising.
- Regionals are a different market: combined regionals are up 0.7% over the same 28 days. The gap to capitals is now 0.7 percentage points, and regionals have stayed positive through the entire capitals downturn.
- What it means: there is no single Australian property market right now. Where your home (or the one you’re looking to buy) sits, capital or regional, which price band, matters more than the national headline.
The federal budget landed on 12 May. Cotality’s daily Home Value Index is the only fresh read on what the market has done since. As of 18 May, the combined capitals 28-day change has turned negative for the first time, at −0.01%. Underneath that average: Sydney and Melbourne are both down 0.7% on the same 28-day reading, while Perth is up 1.7%, Brisbane 1.0%, Adelaide 0.8%. On the other half of the story: combined regionals are up 0.7%.
The trend started before the budget
The daily reading is the day the average tipped, not the day the trend started. Sydney’s monthly reading went 0.0, −0.1, then −0.6 across February, March and April: three soft readings ending in a sharp drop. Melbourne ran the same pattern. The two cities carry the largest weight in the combined capitals, so when both fade, the average follows.
The budget date sits inside this direction of travel, not at the start of it: the slope of the capitals line in the six days since 12 May looks like a continuation of the slope in the six weeks before. Daily data is noisy this close to the event, so it’s a soft read. What it points to is more of the same, not a sudden shift.

A note on what we’re looking at: the daily 28-day rolling change updates each day, comparing today’s index to 28 days ago. The monthly HVI publishes on the 1st with the past calendar month. Both come from the same daily Cotality index. Cotality cautions against reading short-term daily moves too literally, but in a post-budget window where the monthly reading is still two weeks away, the daily index is the only data available.
And within the capitals alone, a 24-point spread
That −0.01% is just an average. Averages hide what each city is doing. Look at the annual data: Perth home values are up +26.0% over the year to April 2026; Melbourne is up +2.0%. The spread is 24 percentage points, the widest in Cotality’s modern dataset.
The middle tells the same story. Brisbane +19.7%, Darwin +19.6%, Adelaide +12.2%: still booming but slowing. Hobart +8.5%, Canberra +5.6%, Sydney +4.2% and Melbourne +2.0% are the laggards. On a national headline, the booming and the laggards cancel out. The combined capitals come in at +9.1% for the year. There is no city in Australia at +9.1%.

Inside the cities, the same split
Even within Sydney and Melbourne, the city-wide numbers hide another two-speed pattern. The upper quartile (the most expensive 25% of houses) is taking the hit; the lower quartile (the cheapest 25%) keeps growing.
Over the March quarter, Sydney’s upper-quartile houses fell 2.4% while lower-quartile houses rose +2.5%. Melbourne shows the same shape: upper down 1.9%, lower up +0.6%. The middle of each market sits between them, close to flat.

Cotality attributes the lower-tier strength to first home buyers, investors and competition for cheaper homes. The premium-tier weakness reflects the way rate hikes and lending rules hit hardest at the top: buyers there are closer to the bank’s lending limits to start with, so even a small tightening in how much they can borrow translates into a bigger price hit.
Where the regionals sit
Combined regionals are up 0.7% over the past 28 days. That’s a roughly 0.7 percentage point gap to the capitals, and it’s been widening for months. The regionals line softened after the peak, but it stayed positive.

The annual picture says the same thing in slower motion. Regional WA is up +20.4% over the year, faster than every capital except Perth itself. Regional QLD is up +14.7%, Regional SA +11.9%, Regional Tas +10.9%, Regional NSW +8.9%, Regional Vic +8.0%. Every one of these is faster than Sydney (+4.2%) and Melbourne (+2.0%). The slowest regional market is outpacing the fastest of the two biggest capitals.

Two things are doing the work. First, regionals are simply cheaper. The regionals median sits around $751,000 against around $1.01 million for the combined capitals. A cheaper home means a smaller loan, so when borrowing conditions tighten, capital city buyers hit the wall first.
Second, people moving within Australia is sustained, not a pandemic blip. The numbers at a glance:

The regional advantage has limits. Cotality’s combined regionals reading has slowed from a recent peak too, at a gentler pace. Annual growth across regional Australia is slowing in line with the capitals slowdown, even if the 28-day reading hasn’t crossed zero. But for an investor reading the headline that “capital city values fell,” the data underneath is that the regional market is still a different market entirely.
What this means for the property market
A national headline isn’t a market, and a city/regional headline isn’t a market either. The question now is which segment of which market you’re exposed to: capital or regional, premium or affordable, exposed to rate moves or insulated from them.
Rates are part of the picture, not the spine. The Reserve Bank of Australia (the RBA) has lifted the cash rate (the rate it sets, which feeds through to mortgages) by 75 basis points (0.75 percentage points) since February: three hikes in three months, back to 4.35%. The daily flip came 12 days after the May hike, into the two cities most exposed to interest rate moves. The budget arrived a week later. The budget didn’t break a market that was rising; it landed on one that was already turning at the top end.
For a deeper read on what the budget actually did to the criteria for picking the right property, see our budget Quick Take. The short version: new property keeps the old rules if you already own; established properties face tighter criteria where rental yield (the annual rent expressed as a percentage of the property’s value) now matters as much as growth potential. The daily index is the first read on what those tighter criteria are landing into.
The bottom line
Two-speed between capitals and regions, two-speed across capital cities, two-speed inside Sydney and Melbourne: the pattern is getting stronger, not weaker. The read isn’t “are prices falling?” It’s which segment of which market you hold.
Cut through the noise on Australian property
Subscribe for free.
Keep reading
- The RBA held the cash rate at 4.35%, a 12-year high. The borrowing-power squeeze is cooling the capitals from the top down, while the regions hold up better.

- Reset or Regime Change? What the Budget’s Tax Changes Mean for Property Prices

- How the 2026-27 Budget’s negative gearing reform affects your borrowing capacity
